%20-%20Copy%20-%20Copy%20-%20Copy.jpg)
Empirical Draw Pattern Mathematics Group Theory:
A New Mathematical Framework for Understanding Lottery Draw Pattern Mathematics Structure Models
A Research White Paper by the Tinkermen Lotto Report
Tinkermen Lotto Report — Home of Empirical Draw Pattern Mathematics (EDPMGT)
Author: John Francis, Founder – Tinkermen Lotto Report
Website: www.tinkermenlottoreportforum.com
Date: June 2026
Version: 1.0
Classification: Public Research White Paper
Validated by Lotto People Magazine | Statistical Collaboration: Michelle Scarbrough, Applied Statistician, Scarbrough Strategies
Tinkermen Lotto Report © 2002–2026. All rights reserved.
Tinkermen Lotto Report | Empirical Draw Pattern Mathematics Group Theory White Paper | Version 1.0 | June 2026
Abstract
This white paper advances a formal mathematical and statistical framework for understanding the structural behavior of lottery draw outcomes across multiple draws. The central thesis is as follows: while individual lottery draws are independently random events in which every possible combination is equally likely, the aggregate distribution of outcomes across hundreds or thousands of draws is not uniformly spread across all possible combinations. Instead, winning combinations cluster into mathematically deterministic groups — a phenomenon the Tinkermen Lotto Report formally terms Lotto Probability Draw Pattern Mathematics (DPM) and, at a higher theoretical level, Empirical Draw Pattern Mathematics Group Theory (EDPMGT).
This paper pursues four primary objectives. First, it defines the theoretical framework of Empirical Draw Pattern Mathematics Group Theory, grounding it in classical combinatorics, probability theory, and the Law of Large Numbers. Second, it demonstrates this framework's mathematical underpinnings through rigorous combinatorial calculations applied to six major world lotteries: Mega Millions, Powerball, California Super Lotto, Euro Millions, Lotto America, and Millionaire for Life. Third, it introduces the Tinkermen lotto Matrix Structure Model as the operational structural tool through which any lottery's sample space may be decomposed into its constituent draw pattern groups, each associated with a calculable Frequency Draw Rate (FDR). Fourth, it explicitly contrasts the DPM framework with conventional, Wikipedia-standard definitions of lottery randomness — arguing that the conventional view is accurate but incomplete, addressing only single-draw probability while leaving the higher-order aggregate structure entirely undescribed.
The research presented herein has been independently validated in 2002 by Lotto People Magazine, whose published commentary stated: "This is a Mathematical Discovery in Lotto — it proves that Lotteries are not completely Random events." Statistical modeling and validation of the Tinkermen Lotto Report's Database Repository were conducted in collaboration with Michelle Scarbrough, applied statistician of Scarbrough Strategies, whose work confirmed that empirical draw data aligns measurably with the theoretical expected mathematical outcomes prescribed by the DPM framework.
The paper concludes with a formal naming-convention proposal — offering "Lotto Probability Draw Pattern Mathematics" as the consensus term for a discipline that has lacked standardized nomenclature — and articulates the strategic, technological, and societal implications of DPM-informed lottery participation.
Table of Contents
Abstract
1. Introduction
1.1 The Central Paradox
1.2 Historical Foundations of Probability and Games of Chance
1.3 The Modern Lottery Era and the Naming-Convention Gap
1.4 Structure of This Paper
2. Theoretical Lottery Mathematics
2.1 Foundations: Probability, Combinatorics, and the Sample Space
2.2 Lottery Matrix Structures and Total Combination Counts
2.3 The Law of Large Numbers and Mathematical Determinism
3. Empirical Draw Pattern Structure: How Winning Combinations Cluster
3.1 The Clustering Phenomenon
3.2 Frequency Draw Rate
3.3 Worked Examples — California Super Lotto
3.4 Practical Implications for Quick Pick Players
4. The Tinkermen Lotto Matrix Structure Model
4.1 What Is the Matrix Model?
4.2 Components of a Full Probability Report
4.3 The Database Repository
4.4 Mega Millions Prediction Performance
5. Empirical Draw Pattern Mathematics Group Theory: Formal Definition
5.1 Defining the Theory
5.2 Naming Convention Proposal
5.3 Historical Lineage
6. Comparison to Wikipedia and Conventional Lottery Probability Descriptions
6.1 The Conventional View
6.2 What DPM Adds
6.3 The Paradigm Gap
7. Implications for Lottery Players and the Industry
7.1 Player Strategy Implications
7.2 Technology as an Enabler
7.3 Societal Implications
8. Conclusion
References
Appendix A: Combinatorial Formula Reference
Appendix B: Draw Pattern Group Count Summary Table
Appendix C: Glossary of Terms
1. Introduction
1.1 The Central Paradox
At the heart of every modern lottery lies a profound and seemingly contradictory statement: the outcome of each individual draw is entirely random, yet the totality of outcomes across many draws is mathematically structured. This is not a contradiction — it is one of the most elegant properties of probability theory — but it has been profoundly underappreciated in the context of lottery analysis. Most players, and indeed most public-facing descriptions of lotteries, engage exclusively with the first half of this statement: the randomness of any given draw. This paper is devoted to the second half: the measurable, predictable structure that emerges in the aggregate.
Imagine a vast ocean in which each wave is unique, unpredictable, and shaped by innumerable variables — wind, current, depth, atmospheric pressure. No two waves are identical; no individual wave can be forecast with precision. And yet oceanographers can predict, with high confidence, the average wave height for a given coastline at a given time of year, the distribution of wave sizes, and the statistical frequency of extreme events. The lottery operates on an analogous principle. Individual draws are waves; the underlying combinatorial structure is the ocean floor that shapes them all.
This paper formally terms the discipline that studies this aggregate structure Lotto Probability Draw Pattern Mathematics (DPM) and presents its highest theoretical expression as Empirical Draw Pattern Mathematics Group Theory (EDPMGT). These are not speculative constructs; they are direct applications of classical mathematics — combinatorics, probability theory, and the Law of Large Numbers — to the specific domain of lottery draw outcomes. The Tinkermen Lotto Report, founded by John Francis in 2002, has been applying, refining, and validating this framework across six major world lotteries for over two decades.
1.2 Historical Foundations of Probability and Games of Chance
Mathematical inquiry into games of chance is not a modern innovation. It is, in fact, among the oldest branches of applied mathematics. The Italian polymath Gerolamo Cardano (1501–1576) produced what is widely regarded as the first systematic treatment of probability in the context of gambling in his posthumously published work Liber de ludo aleae (Book on Games of Chance, c. 1560, published 1663). Cardano's analysis introduced foundational ideas about the enumeration of outcomes and the concept of relative frequency — ideas that remain central to DPM today.
The formal foundations of modern probability theory were laid in 1654 through an extraordinary correspondence between Blaise Pascal and Pierre de Fermat, who exchanged a series of letters addressing the "problem of points" — how to fairly divide the stakes of an interrupted gambling game. Their exchange produced the first rigorous treatment of expected value and combinatorial probability, establishing principles that would govern mathematical thinking about chance for centuries to come.
Christiaan Huygens, building on the Pascal-Fermat correspondence, published De ratiociniis in ludo aleae in 1657 — the first printed work entirely devoted to probability theory. Leonhard Euler's contributions to combinatorics in the 18th century provided the mathematical machinery — factorials, binomial coefficients, and combinatorial enumeration — that forms the direct computational foundation of DPM. Jacob Bernoulli's posthumously published Ars Conjectandi (1713) introduced the Law of Large Numbers in rigorous form for the first time, establishing the theoretical basis for asserting that aggregate lottery draw frequencies converge toward calculable theoretical probabilities over time.
This is not merely a history lesson. It is a demonstration that the mathematical framework upon which DPM rests is among the most thoroughly validated in all of science. Every calculation in this white paper descends directly from principles established and proven by some of the greatest mathematical minds in human history.
1.3 The Modern Lottery Era and the Naming-Convention Gap
Modern government-sponsored lotteries began proliferating widely in the 1960s and 1970s. The New Hampshire Lottery, established in 1964, was the first legal state lottery in the United States in the modern era; by the 1980s, multi-state lotteries such as Powerball and Mega Millions had transformed the scale — and the mathematical complexity — of the enterprise.
Alongside this growth emerged a cottage industry of lottery mathematics analysis. Authors such as Gail Howard, whose landmark work Lotto: How to Wheel a Fortune (1988) introduced millions of readers to combinatorial wheeling strategies, helped establish the notion that mathematical thinking could be productively applied to lottery participation. European analysts developed "Decades Analysis" techniques — a precursor framework to DPM that organized lottery numbers by their sub-matrix group range band groupings (1–9, 10–19, 20–29, etc.) to study structural patterns in draw outcomes.
Despite this substantial body of work, a critical gap has persisted: there exists no consensus name for the mathematical discipline that studies lottery draw-structure models. "Decades Analysis" is used informally among math enthusiasts but is not codified in any academic or industry literature.
Wikipedia's treatment of lottery probability is confined to the calculation of individual-lotto-draw odds. No peer-reviewed journal, academic textbook, or standardized reference defines the field of lottery combinatorial structure analysis models under a unified name with a formal theoretical framework.
This gap matters — not merely as a semantic inconvenience, but as an epistemological barrier. Without a common name, practitioners cannot build on each other's work with shared vocabulary; without a formal framework, insights remain anecdotal rather than scientific; without a theoretical structure, validation is impossible. The Tinkermen Lotto Report proposes to fill this gap with the term Lotto Probability Draw Pattern Mathematics (DPM), and with the theoretical superstructure of Empirical Draw Pattern Mathematics Group Theory (EDPMGT).
"Lotteries are made up of independent random draws, which are mathematically deterministic and that lead to probable outcomes over the course of time, due to the law of large numbers"
Collaboration quote by John Francis, founder of the Tinkermen Lotto Report and Edvin Hiltner, founder of Lottery Codex
1.4 Structure of This Paper
This white paper proceeds as follows. Section 2 establishes the theoretical mathematical foundations — combinatorics, the sample space, lottery matrix structures, and the Law of Large Numbers — providing the reader with the formal tools necessary for everything that follows. Section 3 introduces the empirical clustering phenomenon: how winning combinations aggregate into draw pattern group types of vastly different sizes and therefore vastly different draw pattern frequencies. Section 4 presents the Tinkermen Lotto Matrix Structure Model — the operational framework through which any lottery's sample space is decomposed into its draw pattern group types — along with the structure of a complete Probability Report and performance data from the Tinkermen Database Repository. Section 5 provides the formal definition of Empirical Draw Pattern Mathematics Group Theory and its four axioms, together with the naming-convention proposal and the intellectual lineage of the field. Section 6 contrasts DPM with conventional, Wikipedia-standard lottery probability descriptions. Section 7 explores the strategic, technological, and societal implications of the framework. Section 8 concludes.
2. Theoretical Lottery Mathematics
2.1 Foundations: Probability, Combinatorics, and the Sample Space
To understand Draw Pattern Mathematics (DPM), one must first command the foundational mathematical constructs upon which it is built. The two most important are combinations and permutations.
A permutation is an arrangement of items in which order matters. If we have three colored balls — Red (R), White (W), and Blue (B) — and wish to arrange two of them in sequence, the permutations are: RW, WR, RB, BR, WB, BW — giving us 6 ordered arrangements.
A combination, by contrast, is a selection in which order does not matter. From the same three balls, choosing any 2 gives us: {R, W}, {R, B}, {W, B} — only 3 unordered selections.
This is the relevant construct for lotteries, where the drawn numbers are typically presented in ascending order after the drawing takes place, but the sequence in which balls emerge from the drum by the order they are drawn at the time is irrelevant to winning.
For a more complex example, consider a standard 52-card deck. How many distinct 5-card poker hands can be dealt?
The sample space of a probability experiment is the complete set of all possible outcomes. For a 5-card poker hand, the sample space contains exactly 2,598,960 elements. For a lottery, the sample space is the set of all possible number combinations that could be drawn — and it is this sample space that DPM partitions into many different draw pattern group types.
Every element of the sample space is equally likely on any given draw, which is the basis for the "1-in-N" odds familiar from conventional lottery descriptions. But the fact that all individual combinations are equally likely does not imply that all groups of combinations are equally likely — because groups differ vastly in how many combinations they contain. This asymmetry is the mathematical engine of Draw Pattern Mathematics.

2.2 Lottery Matrix Structures and Total Combination Counts
Each major lottery has a distinct matrix structure — the specification of how many numbers a player selects from a given pool, plus any bonus ball selections from a separate pool. The total number of combinations for a lottery with a main-game selection of k numbers from n, plus a bonus selection of 1 from b, is calculated as:

The worked calculations for all six major lotteries covered in this white paper for the Tinkermen Lotto Report are:
Mega Millions Lotto = pick five numbers from 1 to 70 and one Mega number from 1 to 24
(70*69*68*67*66 / 5*4*3*2*1) * 24=
(1,452,361,680 / 120) * 24=
12,103,014 * 24 = 290,472,336 combinations
Power Ball Lotto = pick five numbers from 1 to 69 and one Powerball number from 1 to 26
(69*68*67*66*65 / 5*4*3*2*1) * 26=
(1,348,621,560 / 120) * 26=
11,238,513 * 26 = 292,201,338 combinations
California Super Lotto = pick five numbers from 1 to 47 and one number from 1 to 27
(47*46*45*44*43 / 5*4*3*2*1) * 27=
(184072680 / 120) * 27 = 41,416,353 total combinations
Euro Millions Lotto = pick five numbers from 1 to 50 and two Star numbers from 1 to 12
(50*49*48*47*46 / 5*4*3*2*1) * (12 * 11) / (2 * 1)=
(254,251,200 / 120) * (132 / 2)=
2,118,760 * 66 = 139,838,160 total combinations
Lotto America Lotto = pick five numbers from 1 to 52 and one Star number from 1 to 10
(52*51*50*49*468/ 5*4*3*2*1) * 10 =
(311,875,200 / 120) * 10 =
2,586,960 * 10 = 25,989,600 total combinations
Millionaire for Life = pick five numbers from 1 to 58 and one Millionaire Ball from 1 to 5
(58*57*56*55*54 / 5*4*3*2*1) * 5 =
(549,853,920 / 120) * 5 =
4,582,116 * 5 = 22,910,580 combinations
These figures define the boundaries of each lottery's sample space and establish the denominators against which all Frequency Draw Rate calculations are performed.
2.3 The Law of Large Numbers and Mathematical Determinism
The Law of Large Numbers (LLN), formally proven by Jacob Bernoulli and published posthumously in Ars Conjectandi (1713), states that as the number of independent trials of a random experiment increase, the observed relative frequency of any given outcome converges toward its theoretical probability.
Formally, for a sequence of independent, identically distributed random variables X₁, X₂, …, Xₙ with expected value μ, the sample mean (X₁ + X₂ + … + Xₙ) / n converges to μ as n approaches infinity.
Applied to lotteries, this principle yields a powerful and underappreciated consequence. Consider a draw pattern group G that contains 3,815,100 combinations out of a total of 41,416,353 possible combinations in California Super Lotto. The theoretical probability that any given draw produces a combination from group G is 3,815,100 / 41,416,353 ≈ 9.21%.
By the Law of Large Numbers, as the number of CSLP draws increases — across years and decades — the observed percentage of draws producing a combination from group G will converge to 9.21%. This is not speculation; it is mathematical law.
This is the precise sense in which John Francis and Edvin Hiltner (Lottery Codex) assert that lotteries are "mathematically deterministic" despite each drawing being individually random. The word "deterministic" here applies to the aggregate distribution, not to individual outcomes. It is critical to distinguish between two levels of analysis:
-
Individual Draw Level: Every combination is equally likely. The outcome is random, unpredictable, and cannot be forecast for any specific draw.
-
Aggregate Distribution Level: Draw pattern group types with more combinations will be drawn proportionally more often over time, with a convergence rate governed by the Law of Large Numbers. This distribution is mathematically deterministic — it is as certain as any theorem in probability theory.
The failure to distinguish between these two levels of analysis has produced a false dichotomy in public ‘News Media’ discourse coverage: the idea that lotteries are either "purely random" (the conventional view) or "predictable" (a naive misconception). Both framings are incomplete. DPM occupies a precise and rigorous middle ground: aggregate predictability within individual randomness.

3. Empirical Draw Pattern Structures: How Winning Combinations Cluster
3.1 The Clustering Phenomenon
Given the mathematical foundation established in Section 2, we can now describe the central empirical phenomenon that Draw Pattern Mathematics addresses: the clustering of winning lottery number combinations into structurally distinct groups.
When we examine the pool of 47 main numbers in California Super Lotto, we observe that these numbers fall naturally into what we term Sub‑Draw Pattern bands (SDP bands):: the numbers 1–9 form one band, 10–19 form another, 20–29 a third, 30–39 a fourth, 40–47 a fifth.
“We define these partitioned smaller number groupings as Sub‑Draw Patterns (SDPs) — also referred to in the EDPMGT framework as Sub‑Matrix Group Range Bands (SMGRBs) — mathematically derived sub‑matrices of the primary lottery number pool.”
Any draw of 5 main numbers will distribute those 5 number selections across these Sub‑Draw Pattern bands in some configuration. One draw might place all five numbers in the 20–29 range; another might place two numbers in the 10–19 range and three in the 30–39 range; another might spread them across five different SDP bands producing what’s termed an Ascending Draw Pattern.
“An Ascending Draw Pattern is a configuration in which each drawn number falls into a different SMGRB, producing a fully distributed pattern across many of the range bands, with no double combinations like 20,21 or 17,19. The ascending draw pattern would look something like this: 4, 13, 26, 38, 45”
Each distinct configuration of how the five drawn numbers distribute across sub-matrix group range bands constitutes a draw pattern group type. The number of combinations that belong to each group type differs enormously — from hundreds to millions — and this disparity is the engine of the clustering phenomenon.
The analogy offered by John Francis is apt and illuminating rainwater, when it falls from the sky, falls randomly across a landscape. Yet it does not remain randomly distributed. The physics of gravity and topography cause it to pool in specific locations — valleys, channels, depressions — in entirely predictable ways.
The individual raindrops’ destination may be unpredictable; the aggregate accumulation of water in pools is not. Similarly, individual lottery draws are random, but the topology of the combinatorial landscape — defined by the lottery's matrix structure model — causes winning combinations to pool in specific draw pattern group types at measurably predictable rates.
This is the core insight of Empirical Draw Pattern Mathematics Group Theory. The "topology" in question is mathematical rather than physical, but it is no less real. Different lotteries have different numbers of draw pattern group types, determined entirely by their matrix model structures:
3.2 Frequency Draw Rate
The Frequency Draw Rate (FDR) is the core metric of Draw Pattern Mathematics. It is defined as the percentage of a lottery's total combinations that belong to a given draw pattern group type and therefore represents the theoretical probability that any given draw produces a combination from within a group.

The FDR is a direct application of classical probability theory: if a draw pattern group type contains m combinations out of a total sample space of N, then the probability of any single draw landing in that group is m/N. The FDR expresses this as a percentage for clarity of comparison across groups.
By the Law of Large Numbers, the observed draw frequency for a pattern group will converge to its FDR over time. A group with an FDR of 9.21% will account for approximately 9.21% of all draws in the long run. A group with an FDR of 0.016% will appear approximately once every 6,250 draws — or, at two draws, approximately once every 60 years. These are not estimates; they are mathematical consequences of the binomial coefficient calculations and the LLN.
The FDR is also directly proportional to the group size: since all combinations are equally likely on any given draw, a group that contains twice as many combinations will be drawn twice as often in the aggregate. Group size is the sole determinant of FDR in a fair draw — a principle formalized in Section 5 as the third axiom of Empirical Draw Pattern Mathematics Group Theory.
3.3 Worked Examples — California Super Lotto
The FDR is a direct application of classical probability theory: if a draw pattern group type contains m combinations out of a total sample space of N, then the probability of any single draw landing in that group is m/N. The FDR expresses this as a percentage for clarity of comparison across groups.
By the Law of Large Numbers, the observed draw frequency for a pattern group will converge to its FDR over time. A group with an FDR of 9.21% will account for approximately 9.21% of all draws in the long run. A group with an FDR of 0.016% will appear approximately once every 6,250 draws — or, with the lottery drawing taking place at two draws per week, approximately once every 60 years. These are not estimates; they are mathematical consequences of the binomial coefficient calculations and the LLN.
The FDR is also directly proportional to the group size: since all combinations are equally likely on any given draw, a group that contains twice as many combinations will be drawn twice as often in the aggregate. Group size is the sole determinant of FDR in a fair draw — a principle formalized in Section 5 as the third axiom of Empirical Draw Pattern Mathematics Group Theory.

Historical validation confirms this extreme rarity: this draw pattern group type has appeared only once in over 20 years of CSLP draw history. The mathematical prediction and the empirical record are in precise agreement.
Example B: The Double Twenty Draw Pattern
The Double Twenty Draw Pattern is defined as the group of all combinations in which exactly 2 of the 5 main numbers fall in the 20–29 sub-matrix group rang band, while the remaining 3 are drawn from other SDP bands. This is a far more populous group:

The contrast is stark and illuminating:

The group size number of combinations difference — 6,804 vs. 3,815,100 — is a factor of approximately 561. The FDR draw rate difference is proportionally identical. This is not coincidence; it is the direct mathematical consequence of the fact that although all combinations are equally likely for each drawing, draw pattern group types are drawn at FDR rates precisely proportional to their sizes. This is one of the main aspects of the empirical evidence side of Draw Pattern Mathematics in action.
3.4 Practical Implications for Quick Pick Players
Approximately 70% of all lottery tickets sold are Quick Pick tickets — combinations generated randomly by lottery terminal computers at the moment of purchase. Quick Pick algorithms generate combinations uniformly across the entire sample space, which means the distribution of Quick Pick tickets across draw pattern group types mirrors exactly the distribution of combinations across all of the given group types possible, mathematically for a given lottery structure model: groups with more combinations distribute proportionally more Quick Pick tickets out to the public for larger group types.
The practical implication is significant. For every 1 million Quick Pick tickets purchased for a CSLP draw, approximately 160 tickets will fall into the Quinto Twenty group (FDR 0.016%) — combinations that, by mathematical law, the lottery draw will produce only once per several decades. Those 160 ticket holders have effectively no probability of winning within any reasonable playing horizon, simply by virtue of the draw pattern group type their associated lottery ticket randomly generated combination inhabits.
To further illustrate, consider the Quad Forty Draw Pattern for CSLP — a group in which exactly 4 of the 5 main numbers fall in the 40–47 range. This group contains approximately 73,710 combinations and carries an FDR of approximately 0.18%. For every 1 million Quick Pick buyers per draw, approximately 1,800 tickets fall into this group — which the lottery will produce, on average, approximately once every 556 draws (roughly 5 years at two draws per week).
By contrast, players using DPM-informed combinations — selecting numbers from pattern groups with FDRs of 6–9% — hold tickets in groups that the lottery draw will visit, on average, every 11–17 draws. The expected waiting time before the specific group type appears is reduced by a factor of hundreds compared to a low-FDR group.

3. The Tinkermen Lotto Matrix Structure Model
3.1 What is the Matrix Model?
The Tinkermen Lotto Matrix Structure Model is the structural framework developed by John Francis and the Tinkermen Lotto Report for decomposing a lottery's complete sample space into its constituent draw pattern group types. It is the operational backbone of DPM — the tool through which abstract combinatorial theory is translated into actionable analysis.
Each lottery is assigned a Matrix Model Structure — a multi-dimensional grid organized along two primary axes. The rows of the matrix represent the lottery's sub-matrix group range bands (1–9, 10–19, 20–29, 30–39, 40–47 for CSLP; 1–9, 10–19, 20–29, 30–39, 40–49, 50–59, 60–69, 70 for Mega Millions, etc.).
The columns represent the five positions of the main number draw. Each cell of the matrix specifies which sub-matrix group range band contributes numbers to which draw positions in a given pattern group type configuration.
The matrix for each pattern group type defines, with mathematical precision, the structural relationship among the five drawn numbers. From this structural definition, the combinatorial calculation flows directly: multiply the number of ways to choose numbers from each specified sub-matrix group range band, then multiply by the bonus ball count, to obtain the total combinations for that pattern group. The FDR is then calculated by dividing by the total sample space.
The matrix model thus provides a systematic, repeatable, and exhaustive method for identifying every possible draw pattern group type in any lottery. Its outputs — the set of pattern groups, their combination counts, and their FDRs — form the complete mathematical landscape of that lottery's aggregate draw behavior.
Example: California Super Lotto Plus – Double Low Matrix Model, showing how many numbers are drawn from each sub-matrix group range band.

4.2 Components of a Full Lotto Probability Report
A complete Tinkermen Lotto Probability Draw Pattern Mathematics Model Structure Report comprises seven standard components, each serving a distinct analytical function:
-
Past Draws Page: A comprehensive listing of all historical draws for the lottery, organized and color-coded by draw pattern group type. This page enables visual identification of which pattern groups have been active and how frequently each group has appeared in the historical record.
-
Statistics Page: A quantitative comparison of the actual draw frequency observed for each pattern group in the historical record versus the theoretical expected frequency derived from each group's mathematical FDR rate. This page serves as the primary empirical validation tool — demonstrating whether observed draw behavior conforms to the mathematical predictions of the DPM framework.
-
Draw Order Page: A chronological listing of all past draws organized simultaneously in ascending order by date, and by draw pattern group type, enabling a time-series visual analysis of number pattern group sequences and facilitating the identification of historically underrepresented numbers that may be due for increased frequency.
-
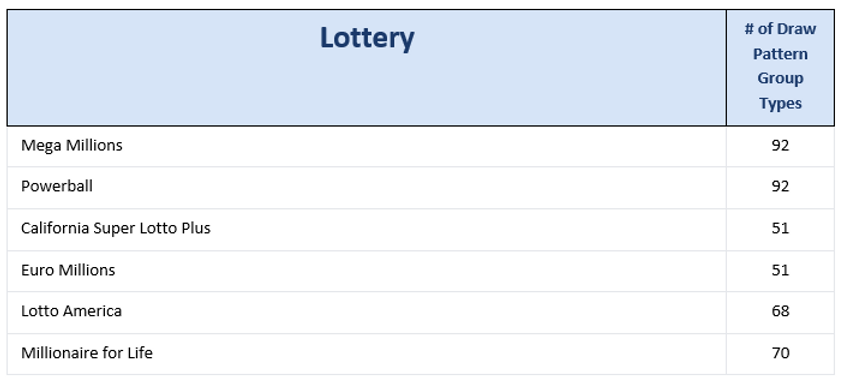
Mathematics Model Page: The complete combinatorial calculations for every draw pattern group type in the lottery — showing the C(n,k) calculations, total combinations per group, FDR, and expected draw frequency for each of the 51 (CSLP), 92 (Mega Millions/Powerball), 68 (Lotto America), or 70 (Millionaire for Life) group types.
-
Matrix Model Page: The structural matrix grid for each draw pattern group type — the foundational document from which all combinatorial calculations are derived. This page serves as the primary reference for understanding the geometric structure of a lottery's sample space.
-
Legend Page: A comprehensive notation guide including: the alpha-code system used to identify draw pattern group types (e.g., CSLP1 = California Super Lotto Pattern Group 1, MM47 = Mega Millions Pattern Group 47), the factorial calculation reference, and all abbreviations, colors and symbols used throughout the report.
-
Chart Page: Allows for visual comprehensive analysis of draw pattern behavior over time, describing analytically the conditions for when certain draw patterns may be most due.
4.3 The Database Repository
In 2020, the Tinkermen Lotto Report launched a publicly accessible Database Repository — a comprehensive analytical database covering Mega Millions, Powerball, Lotto America, Lucky for Life, Euro Millions, and California Super Lotto. Note: Lucky for Life ended and was replaced by Millionaire for Life in January 2026. The repository’s early development was assisted with the collaboration of Michelle Scarbrough, applied statistician of Scarbrough Strategies, whose role was to help isolate additional matrices faster and validate the statistical models that underpin the repository's analytical outputs.
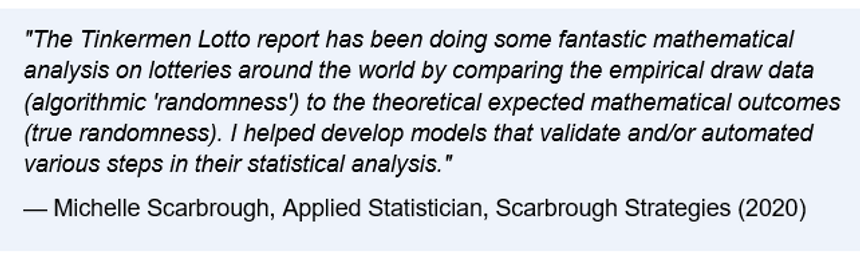
Scarbrough's statement encapsulates the precise epistemological structure of the DPM validation process: comparing empirical draw data (the observed distribution of actual winning combinations across pattern groups) to theoretical expected mathematical outcomes (the FDR-derived expected distribution). The degree of convergence between these two distributions constitutes the empirical validation of the DPM framework — and, in turn, of Empirical Draw Pattern-Group Theory.
The Database Repository enables the following analytical capabilities:
-
Historical draw-by-draw pattern group classification for all covered lotteries
-
Running comparison of observed vs. expected draw frequencies by pattern group
-
Identification of overrepresented and underrepresented pattern groups relative to their theoretical FDRs
-
Generation of DPM-informed number combinations from within selected high-frequency pattern groups
-
Time-series visualization of pattern group activity across multiple years of draw history
Across all six covered lotteries, the Tinkermen Lotto Report's Database Repository draw pattern prediction platform has achieved a correct draw pattern prediction rate of over 90% of the time accuracy since Aug 3rd, 2021— meaning that in more than 90% of draws, the actual winning combination falls within one of the pattern group types that the model's statistical framework identifies as ‘Most Due’ or very active. This performance metric is not a claim about predicting specific winning numbers; it is a claim about accurately anticipating which category of combinations the draw will produce — a fundamentally different and mathematically grounded assertion.
4.4 Mega Millions Prediction Performance
To illustrate the predictive framework in action, we examine the Mega Millions lottery in more detail. Mega Millions has 92 distinct, and different major draw pattern group types. From these 92 groups, the Tinkermen Lotto Report selects 22 groups as the active focus of its published predictions — those groups that the statistical analysis identifies as most due or very active based on, mathematics and historical draw frequency comparisons associated with theoretical FDRs.
The first formally recorded prediction for the Mega Millions lottery using this framework was made for the Double Forty Draw Pattern, with a prediction date of June 4th, 2019. The Double Forty Draw Pattern for Mega Millions is defined as a combination in which exactly 2 of the 5 main numbers fall in the 40–49 sub-matrix group range band. This group contains approximately 22 million combinations out of Mega Millions' total of 290,472,336 — representing one of the mathematically higher-frequency draw pattern group types with an FDR in the range of approximately 7.6%.
The significance of this prediction platforms framework is not that it identifies the specific winning combination in advance — no mathematical framework can do that — but that it correctly identifies the structural category of the winning combination: the draw pattern group type. When the actual draw produces a Double Forty combination on or near the predicted date, the model has successfully identified, from 92 possible other group types, in predicting the correct group type — an outcome with a probability is far higher than leaving it to pure random chance.
5. Empirical Draw Pattern Mathematics Group Theory: Formal Definition
5.1 Defining the Theory
Having established the mathematical foundations, demonstrated the clustering phenomenon with worked examples, and described the operational framework of the Tinkermen Lotto Report Matrix Structure Model, we are now in a position to provide the formal definition of the theory that encompasses all of the above.

EDPMGT rests upon four foundational axioms:
Axiom 1: Combinatorial Completeness
Every possible draw outcome belongs to exactly one draw pattern group type, as defined by the lottery's matrix structure model. The set of all draw pattern groups is exhaustive and mutually exclusive — a complete partition of the sample space. No combination is unclassified; no combination belongs to more than one group.
Axiom 2: Frequency Determinism
Each draw pattern group's long-run draw frequency converges to its theoretical Frequency Draw Rate (FDR) as the number of draws increases, in accordance with the Law of Large Numbers. Given sufficient draw history, the observed percentage of draws producing a combination from any given group will be statistically indistinguishable from that group's FDR.
Axiom 3: Group Size Primacy
The number of combinations within a draw pattern group is the sole determinant of its FDR — no other structural bias exists in a fair draw. Since every combination is equally likely on any given draw, the probability that the draw produces a combination from any group is directly proportional to the number of combinations within that group. No pattern group enjoys any structural advantage beyond its size.
Axiom 4: Empirical Verifiability
Draw pattern group frequencies observed in historical draw data are measurably consistent with theoretically derived FDR values, validating the framework empirically. EDPMGT makes specific, quantitative predictions about observed draw distributions, which can be tested against historical draw records. The Tinkermen Lotto Report's Database Repository, validated by Scarbrough Strategies, provides the empirical evidence base for this axiom.
5.2 Naming Convention Proposal
The discipline described by EDPMGT has been practiced informally for decades under the folk term “Decades Analysis” among lotto‑math enthusiasts dating back to the 1970s. This informal tradition reflects a body of unverified, anecdotal observations — a kind of “folk wisdom” about number‑range clustering — that lacked formal validation, methodological rigor, or a standardized mathematical framework.
Within the context of modern research terminology, this places EDPMGT squarely within the domain of Practice‑Based Evidence (PBE): a methodology in which real‑world data and long‑term observational practice generate the evidence that ultimately defines the theory. Unlike Evidence‑Based Practice, which applies pre‑existing research to guide decisions, EDPMGT derives its principles directly from the systematic measurement of historical lottery draws associated to its probability structure model.
Although “Decades Analysis” appears in scattered online discussions, it has never been formally defined, standardized, or recognized in academic or industry literature. It remains what linguists classify as a folk term: descriptive of practice, but absent from any normative, mathematical, or empirical framework. EDPMGT formalizes this previously informal domain into a structured, evidence‑driven discipline. The Tinkermen Lotto Report proposes the formal name Lotto Probability Draw Pattern Mathematics (DPM) for this discipline. This name was chosen with deliberate intentionality, with each of its three components carrying specific meaning:
-
"Lotto Probability" — identifies the subject field (lotteries) and the nature of the inquiry (probabilistic analysis), distinguishing this discipline from other branches of lottery mathematics such as ticket-wheeling strategy or jackpot odds computation.
-
"Draw Pattern" — specifies the precise subject matter: the structural clustering of drawn number combinations into pattern group types based on the combinatorial geometry of the lottery's sample space. This phrase distinguishes DPM from probability theory generally and from lottery odds calculation specifically.
-
"Mathematics" — classifies the discipline within the domain of mathematics, asserting its rigor, its grounding in proven theorems, and its susceptibility to formal proof and empirical testing.
The naming analogy is instructive. Albert Einstein's General Theory of Relativity and Special Theory of Relativity each name, with a single unifying title, a vast framework of equations, principles, and applications that might otherwise be described only in fragmentary terms. The name "Special Theory of Relativity" tells the informed reader everything essential about the framework's domain and character. In the same way, "Lotto Probability Draw Pattern Mathematics" names the entire field of lottery combinatorial structure analysis — providing the shared vocabulary that the field has lacked for decades.
5.3 Historical Lineage
Empirical Draw Pattern Mathematics Group Theory and Lotto Probability Draw Pattern Mathematics (DPM) do not emerge from a vacuum. They represent the culmination of a lineage of mathematical inquiry spanning more than four centuries:

6. Comparison to Wikipedia and Conventional Lottery Probability Descriptions
6.1 The Conventional View
Wikipedia and mainstream public-facing descriptions of lotto probability present a mathematically accurate picture at the level they address. The conventional treatment establishes that any given lottery combination has a probability of 1/N of being selected on any given draw, where N is the total number of combinations in the sample space.
For Mega Millions, this yields the familiar figure of 1 in 290,472,336 for a jackpot-winning ticket. The conventional public conceptional view characterizes lottery draws as "random" events in which each possible combination is equally likely, and notes that buying more tickets increases one's probability of winning proportionally but never to any level that could be described as significant relative to the total sample space.
This framing is mathematically correct. No claim in this paper contradicts it. Every individual lottery draw is a random event; every combination is equally likely on every draw; the probability of any specific ticket winning on any given draw is 1/N. These are facts, and they are facts that DPM accepts and builds upon.
What the conventional view does not address — indeed, what it has no framework to address — is the question of how lottery outcomes are distributed across structural categories of combinations over many draws. The Wikipedia treatment of lotto probability answers the question: "What is the probability that my specific ticket wins on this draw?" It does not address the question: "Which classes of number combinations appear with what relative frequency (FDR) across thousands of draws, and how can I ensure my combination belongs to a frequently appearing class?"
6.2 What DPM Adds
Draw Pattern Mathematics adds a second, higher-order layer of analysis that is entirely consistent with the conventional view and adds explanatory and predictive power that the conventional view does not possess. The relationship between the two can be understood through an analogy from basic probability:
In a standard deck of 52 playing cards, the probability of drawing any specific card (say, the Three of Diamonds) is 1/52 ≈ 1.92%. This is the conventional, specific-outcome probability.
But it is equally correct — and additionally informative — to note that the probability of drawing any red card is 26/52 = 50%, and the probability of drawing any face card is 12/52 ≈ 23.1%. These higher-order statements are perfectly consistent with the 1/52 probability of any specific card; they simply operate at a different level of granularity. Knowing that you are more likely to draw a red card than a specific red card is not a contradiction — it is an additional mathematical truth.
DPM applies precisely this logic to lotteries. The probability of any specific combination is 1/N on each draw — this is the conventional level of analysis. DPM adds the complementary truth: the probability that any given draw produces a combination from draw pattern group type G is |G|/N, where |G| is the number of combinations in group G. Since |G| varies enormously across groups (from hundreds to millions), the group-level probability varies proportionally to the matrix structure model— and this variation is deterministic, calculable, and empirically validated.

6.3 The Paradigm Gap
The most significant observation in this comparison is not that the conventional view is wrong — it is that a profound and actionable analytical framework exists that has never been formalized, named, or standardized in any publicly accessible reference. There is no Wikipedia article on "lottery draw pattern mathematics analysis," no academic paper that defines "Decades Analysis" in formal terms, and no standardized reference that describes the field of lottery combinatorial structure model analysis under a unified name with a formal theoretical framework.
The closest analogues in the literature — Renato Gianella's geometric model and the McPherson/Hodson combinatorics work — each approach the same underlying reality from different directions and with different terminologies. Gianella speaks of "templates" and "combinatorial patterns"; McPherson and Hodson speak of "combinations" and "structural analysis." The lack of consensus terminology means that practitioners in this emerging field cannot communicate with shared vocabulary, cannot build on each other's published work with clear cross-references, and cannot establish the kind of cumulative scientific progress that a named discipline enables.
This paradigm gap is the primary motivation for the Tinkermen Lotto Report's naming-convention proposal. By proposing "Lotto Probability Draw Pattern Mathematics" as the consensus term — and by publishing this white paper as a formal articulation of the framework — the Tinkermen Lotto Report seeks to catalyze the kind of disciplinary consolidation that has historically accelerated progress in every scientific field: a shared name, a shared framework, and a shared vocabulary for those who study the structured aggregate behavior of lottery draw outcomes.
7. Implications for Lottery Players and the Industry
7.1 Player Strategy Implications
The practical implications of Draw Pattern Mathematics for lottery players begin with a fundamental reframing of the strategic question. The conventional strategic advice — "buy more tickets" — is mathematically sound as far as it goes: each additional ticket does increase one's probability of winning proportionally. But it does not address the question of which combinations to select across those tickets. DPM provides a rigorous answer.
By selecting combinations from draw pattern group types with high FDRs (6–9% for major lotteries), a player ensures that their combination belongs to a structural category that the lottery draw visits frequently — on average, every 11–17 draws for the highest-FDR groups. By contrast, a player whose Quick Pick ticket falls into a low-FDR group (0.016%) holds a combination in a category that the lottery will visit approximately once per several decades. The individual probability of winning on any given draw remains the same for both players — 1/N. But the DPM-informed player's combination is structurally aligned with the lottery's aggregate draw behavior in a way that the low-FDR player's combination is not.
The analogy to professional poker is illuminating. Champions such as Daniel Negreanu, Phil Hellmuth, and Doyle Brunson do not win at poker by knowing what cards will be dealt. They win by consistently making decisions that align with optimal probability — folding poor starting hands, betting aggressively on strong ones, and reading the statistical distribution of outcomes over thousands of hands. The same principle applies to DPM-informed lottery play: consistent alignment with high-frequency structural categories does not guarantee any specific win, but it reduces the probability that a player's combination is structurally excluded from appearing within any reasonable playing horizon.
7.2 Technology as an Enabler
The emergence of mobile technology and lottery ticket-courier applications has transformed the practical accessibility of DPM-informed play. Where once a player would need to manually calculate draw pattern group play for any given combination, if they knew about it — a task requiring familiarity with the matrix structure models and combinatorial arithmetic — mobile applications can help perform this classification instantly and automatically, if chosen.
The Tinkermen Lotto Report has developed a dedicated mobile application (available on Kiosk, iOS and Android) that provides generated number combinations from within predicted high-frequency draw pattern group types. The application translates the DPM framework — the Matrix Structure Model, FDR calculations, and historical draw pattern group analysis from the Database Repository — into an accessible, consumer-facing interface. Users can generate combinations aligned with the report's current draw pattern group predictions without needing to perform or understand the underlying mathematics themselves.
This technological layer represents a structural shift in how the public can interact with the lottery. Just as the spreadsheet democratized financial modeling, and just as mapping applications democratized navigation, the Tinkermen Lotto Report's mobile application democratizes access to DPM-informed lottery strategy. The mathematical insight is no longer confined to those with the expertise to apply it manually; it is quickly becoming available more and more to any lottery player with a smartphone.
7.3 Societal Implications
At scale, widespread adoption of DPM-informed lottery play using more favorable number combinations carries implications that extend beyond individual player strategy. Consider the following thought experiment: if the 70% of lottery players who currently use Quick Pick shifted to DPM-informed combinations concentrated in high-FDR draw pattern group types, the aggregate distribution of purchased tickets across draw pattern groups would shift dramatically.
A higher proportion of tickets would fall in groups that the lottery visits every 11–17 draws rather than every several decades. The mathematical consequence is that, over any given year of lottery draws, a higher proportion of draws would occur in group types where a significant number of tickets exist — increasing the probability that at least one or multiple tickets match the winning combination in those draws.
This is not a guarantee of more winners per draw per say — individual draws remain random — but it is a probabilistic consequence of concentrating ticket purchases in higher-FDR structural categories. The lottery does not change; what changes is the alignment between where players concentrate their entries and where the lottery's aggregate draw pattern behavior concentrates its outcomes.
John Francis offers the following analogy: at a baseball game, foul balls occasionally fly into the stands and, in our thought experiment, represent a prize of one million dollars. Savvy spectators who understand the geometry of foul-ball trajectories from each side of the plate would choose seats in high-probability foul-ball zones — not because they can predict which foul ball will be hit, but because they know which zones foul-balls concentrate in over the course of a game. The same logic applies to draw pattern selection: choosing combinations from high-FDR draw pattern group types is equivalent to sitting in the high-probability foul-ball zone of the lottery's combinatorial geometry
8. Conclusion
This white paper has advanced a formal mathematical and statistical framework — Empirical Draw Pattern Mathematics Group Theory (EDPMGT) — otherwise known as Lotto Probability Draw Pattern Mathematics (DPM) for understanding the structured aggregate behavior of lottery draw outcomes. “In this white paper, EDPMGT refers to the formal mathematical theory, while DPM refers to its practical application within real lottery draw‑pattern mathematics analysis and approach.”
The central argument may be stated with precision: lottery draws are individually random events, in which every possible combination is equally likely on every draw, and in which no specific outcome can be predicted in advance. At the same time, the aggregate distribution of lottery draw outcomes across many draws is not structurally uniform across the sample space — it is organized by the combinatorial geometry of that space into draw pattern group types of vastly different sizes and therefore vastly different draw pattern frequencies.
This aggregate structure is mathematically deterministic, empirically verifiable, and predictable through the application of classical probability theory and the Law of Large Numbers.
This structure is captured by Draw Pattern Mathematics (DPM) and its four foundational axioms, which we restate here for clarity:
-
Combinatorial Completeness: Every draw outcome belongs to exactly one draw pattern group.
-
Frequency Determinism: Each group's long-run draw frequency converges to its theoretical Frequency Draw Rate.
-
Group Size Primacy: The size of a pattern group — and only its size — determines its FDR in a fair draw.
-
Empirical Verifiability: Pattern group frequencies observed in historical draw data are measurably consistent with theoretically derived FDR values.
The naming-convention proposal advanced in this paper — Lotto Probability Draw Pattern Mathematics as the consensus term for this discipline — is offered in the spirit of scientific progress. Fields advance when they have names; disciplines consolidate when they have shared vocabulary; research accelerates when practitioners can build explicitly on each other's work. The absence of a standardized name for this discipline has left a significant body of mathematical insight underorganized and underacknowledged. This paper seeks to remedy that.
The Tinkermen Lotto Report extends an open invitation to mathematicians, statisticians, lottery analysts, players, and public-interest advocates to engage with this framework — to examine it, critique it, test it against new data, and extend it. The Database Repository at tinkermenlottoreportforum.com is publicly accessible. The methodology is transparent and reproducible. The mathematics is entirely standard — classical combinatorics and probability theory that has been settled science for three centuries.
The lottery has always been a game of chance. What this paper demonstrates is that chance, properly understood, has structure — and that structure, once seen, cannot be unseen.
Tinkermen Lotto Report Database Repository
References
1. Cardano, G. (c. 1560, published 1663). Liber de ludo aleae [Book on Games of Chance]. Posthumously published.
2. Pascal, B., & Fermat, P. (1654). Correspondence on Probability Theory. [Original letters, mathematical correspondence.]
3. Huygens, C. (1657). De ratiociniis in ludo aleae [On Reasoning in Games of Chance]. Leiden: Elzevier.
4. Bernoulli, J. (1713). Ars Conjectandi [The Art of Conjecturing]. Basel: Thurneysen Brothers.
5. Howard, G. (1988). Lotto: How to Wheel a Fortune. New York: Gail Howard.
6. Howard, G. (n.d.). "Lotteries Turn Dumb Luck into Smart Luck." [Published work on lottery strategy].
7. Gianella, R. (n.d.). The Geometry of Chance: Lotto Numbers Follow a Predicted Pattern. Lotto Rainbow. [Published research on combinatorial lottery structure].
8. McPherson, I., & Hodson, D. (n.d.). Lottery Combinatorics. [Published work on lottery combinatorial analysis].
9. Materese, T. (2002). [Validation commentary: "This is a Mathematical Discovery in Lotto — it proves that Lotteries are not completely Random events."]. Lotto People Magazine.
10. Francis, J. (2002–2026). Tinkermen Lotto Probability Report. Tinkermen Lotto Report. tinkermenlottoreportforum.com.
11. Francis, J., & Hiltner, E. (2020). [Collaboration statement quote on mathematical determinism: "Lotteries are made up of independent random draws, which are mathematically deterministic and that lead to probable outcomes over the course of time, due to the law of large numbers."]. Tinkermen Lotto Report & Lottery Codex.
12. Scarbrough, M. (2020). [Statistical validation statement on the Tinkermen Lotto Report Database Repository]. Scarbrough Strategies.

Appendix B: Glossary of Terms
Alpha Code:
A standardized notation system used in Tinkermen Lotto Reports to identify specific draw pattern groups within a given lottery. For example, CSLP1 denotes California Super Lotto Pattern Group 1; MM47 denotes Mega Millions Draw Pattern Group 47. Alpha codes enable consistent cross-referencing across the Past Draws Page, Statistics Page, Draw Order Page, and Mathematics Model Page of a full report.
Binomial Coefficient (see also: Combination):
The number of ways to choose k items from a set of n items without regard to order, denoted C(n,k) or "n choose k." Calculated as: C(n,k) = n! ÷ (k! × (n−k)!). The binomial coefficient is the foundational arithmetic operation of Draw Pattern Mathematics.
Combination:
A selection of items from a larger pool in which the order of selection does not matter. In lottery mathematics, a "combination" refers to any unique set of numbers that could be drawn, expressed in ascending order. Contrast with Permutation.
Decades Analysis:
An informal term, used in the past among lottery mathematics enthusiasts, for the practice of analyzing lottery draw outcomes by organizing drawn numbers according to their sub-matrix group range band (1–9, 10–19, 20–29, etc.) and studying the structural patterns that result. Decades Analysis is the informal precursor to what the Tinkermen Lotto Report formally terms as Draw Pattern Mathematics (DPM). The term is not standardized in any academic or industry reference.
Draw Pattern Group Type:
A structurally defined subset of a lottery’s total sample space, consisting of all combinations in which the five main drawn numbers distribute across Sub‑Draw Pattern (SDP) bands — also known in the EDPMGT framework as Sub‑Matrix Group Range Bands (SMGRBs) — in a specific configuration. Each lottery has a fixed number of draw pattern group types determined entirely by its matrix structure model. Every possible combination belongs to exactly one draw pattern group type.
Draw Pattern Mathematics (DPM):
The formal name proposed by the Tinkermen Lotto Report for the mathematical discipline that studies the structural clustering of lottery draw outcomes into draw pattern groups and the predictable long-run frequency (FDR) behavior of those groups. Full name: Lotto Probability Draw Pattern Mathematics. DPM is grounded in combinatorics, probability theory, and the Law of Large Numbers, and is operationalized through the Tinkermen Lotto Report platform Matrix Structure Model.
Empirical Draw Pattern Mathematics Group Theory (EDPMGT):
The overarching theoretical framework — formally defined in this white paper — that describes how the outcomes of repeated independent random combinatorial draws aggregate into structurally distinct, frequency-differentiable groups (draw pattern groups) whose long-run draw frequencies are predictable through combinatorics and the Law of Large Numbers. EDPMGT is the theoretical superstructure of which DPM is the applied instantiation.
Factorial (n!):
The product of all positive integers from 1 to n, inclusive. Written n! and pronounced "n factorial." For example, 5! = 5 × 4 × 3 × 2 × 1 = 120. By definition, 0! = 1. Factorial operations are central to computing the binomial coefficient and therefore to all combinatorial calculations in DPM.
Frequency Draw Rate (FDR):
The primary metric of Draw Pattern Mathematics. The FDR for a given draw pattern group type G is defined as: FDR = (Combinations in G ÷ Total Combinations) × 100, expressed as a percentage. The FDR represents the theoretical probability — expressed as a percentage — that any given draw produces a combination belonging to group G. By the Law of Large Numbers, the observed draw frequency of any group converges to its FDR over time.
Law of Large Numbers (LLN):
A fundamental theorem of probability theory, formally proven by Jacob Bernoulli (Ars Conjectandi, 1713), which states that as the number of independent trials of a random experiment increases, the observed relative frequency of any outcome converges toward its theoretical probability. In the context of DPM, the LLN establishes that the long-run draw frequency of any draw pattern group will converge to that group's FDR as the number of lottery draws increases.
Matrix Structure Model:
The Tinkermen Matrix Structure Model is the structural framework used to decompose a lottery's sample space into its constituent draw pattern groups. It takes the form of a multi-dimensional grid in which rows represent sub-matrix group range bands and columns represent the five positions of the main number draw. Each cell specifies which sub-matrix group range band contributes numbers to which draw positions for a given pattern group type. The Matrix Structure Model is the source document from which all DPM combinatorial calculations are derived.
Permutation:
An arrangement of items in which the order of selection matters. For k items chosen from a pool of n, the number of permutations is P(n,k) = n! ÷ (n−k)!. In lottery mathematics, permutations are not directly relevant (since draw outcomes are order-independent), but understanding the distinction between permutations and combinations is foundational to all combinatorial analysis.
Quick Pick:
A lottery ticket in which the numbers are generated randomly by the lottery terminal computer at the moment of purchase, rather than selected by the player. Approximately 70% of all lottery tickets sold are Quick Pick tickets. Quick Pick algorithms generate combinations uniformly across the total sample space, meaning the distribution of Quick Pick tickets across draw pattern group types mirrors exactly the distribution of combinations (i.e., proportional to group size). This ensures that many Quick Pick players receive combinations from low-FDR groups — combinations that appear very rarely in the historical draw record.
Sample Space:
In probability theory, the sample space of an experiment is the complete set of all possible outcomes. For a lottery, the sample space is the set of all possible number combinations that could be drawn. The size of the sample space is calculated using the binomial coefficient: for a lottery that picks k numbers from n, the sample space contains C(n,k) combinations (multiplied by the bonus ball count if applicable). DPM partitions this sample space into an exhaustive set of mutually exclusive draw pattern groups.

Authorship & Publication Notice
This white paper was authored and produced by John Francis, Founder of the Tinkermen Lotto Report, as part of the organization’s ongoing research program in empirical lottery mathematics. The work reflects more than two decades of applied analysis, database modeling, and theoretical development across multiple world lotteries.
Rights & Public Use
This document is released as a public research white paper. Readers are permitted to download, share, cite, and reference this work for non‑commercial, educational, and research purposes, provided proper attribution is given to the author and the Tinkermen Lotto Report. Commercial reproduction, redistribution, or derivative works require prior written permission.
Official PDF Edition
A downloadable PDF version of this white paper is available via the link below:
DOI: https://doi.org/10.6084/m9.figshare.32811065
Francis, J. (2026). Empirical Draw Pattern Mathematics Group Theory: A New Mathematical Framework for Understanding Lottery Draw Pattern Mathematics Structure Models. Tinkermen Lotto Report Research Division.